Comprehensive Analytics Solutions
Dashboards & Executive Reporting
The right numbers, for the right people. Without the noise.
Executives don't need more charts — they need the few that matter, surfaced at the right time. We design dashboards that lead the eye, prioritise the decision, and strip out everything that doesn't help someone act.
- KPI definition workshops that align finance, ops, and leadership on one number
- Executive dashboard design with ruthless information hierarchy
- Data storytelling frameworks for board decks, QBRs, and investor updates
- Mobile-optimised views and drill-downs from headline to root cause
- Custom visualisation and brand-consistent styling your team can reuse

Self-Service Analytics & Semantic Layers
"Revenue" shouldn't mean something different to Finance and Sales.
Every organisation has the same problem: four teams, four definitions of the same metric, four dashboards that don't reconcile. We build a single source of truth for every metric — defined once, governed centrally, consumed everywhere.
- Semantic layers that speak your business's language, not your schema's
- Metric definitions versioned, reviewed, and approved like code
- Cross-tool consistency — same number in every dashboard, every export, every API
- User-friendly data marts curated by domain
- Training, enablement, and access control frameworks that drive real adoption
- Usage analytics to see what's working and what's abandoned

Embedded & Multi-Tenant Analytics
Analytics as a product feature, not an afterthought.
Your customers don't want to log into another tool. They want insights inside your product, branded as yours; so fast that nobody notices it's there — and strictly isolated from every other tenant.
- SDK and iframe-based integration patterns with sub-second performance
- Row-level and column-level security that holds up to audit
- Tenant provisioning automation with zero-touch onboarding
- Performance isolation so one noisy tenant doesn't slow the others
- White-label theming and per-tenant branding down to the tooltip
- Usage-based metering and billing hooks
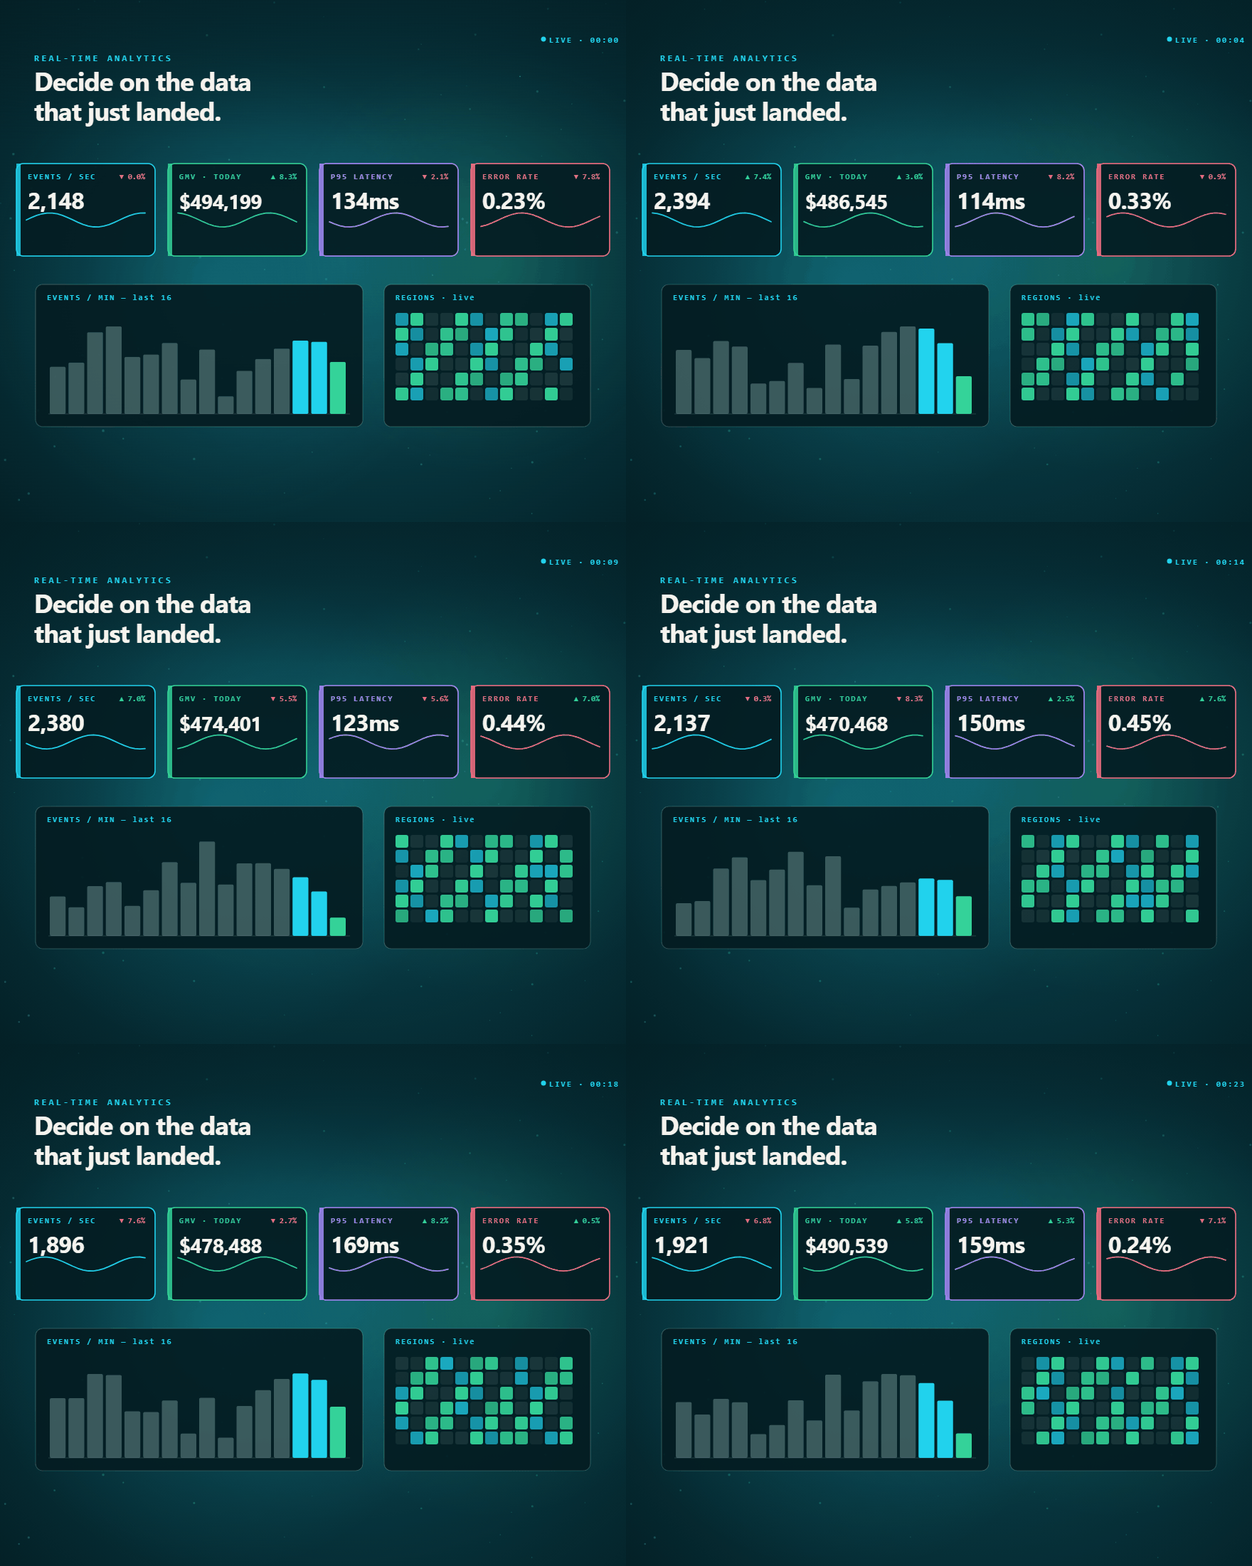
Operational & Real-Time Analytics
See problems before your customers do.
The difference between a great operations team and a firefighting one is how early they see the signal. We build real-time operational layers that surface drift, anomalies, and SLA breaches the moment they happen.
- Real-time operational dashboards refreshed in seconds, not hours
- Anomaly detection with statistically meaningful thresholds
- Process mining to surface hidden bottlenecks in workflows
- Threshold-based alerting that routes to the right owner
- Operational SLA tracking with accountability built in